Global Equities: Powering to the upside
May, 16, 2017 By Ranajay Banerjee 0 comments

Shanghai 3113/ Dow 20982/ World 1902/ CBOE VIX 10.45/ Sensex 30550
RECAP:
In the Apr’17 report, we expected the markets to take long overdue rest and correct a bit before continuation of the present bull market. Both Dow and Nifty were expected to trade within ranges of 20300-21500 (+/-300) and 8800-9300 (+/-200) respectively and see corrective dips within the stated ranges. However, instead of dipping, both indices have moved up within their stated ranges.
EXECUTIVE SUMMARY:
While China is weakening visibly, the other major markets are very comfortable at the higher levels and this most unloved bull market may continue climbing the wall of worries. We look for 2980 on Shanghai, 21200-300 on Dow Jones in May. In case of Nifty, we would prefer to watch the price action near the make or break level of 9500.
Shanghai: Waiting for bearish confirmation
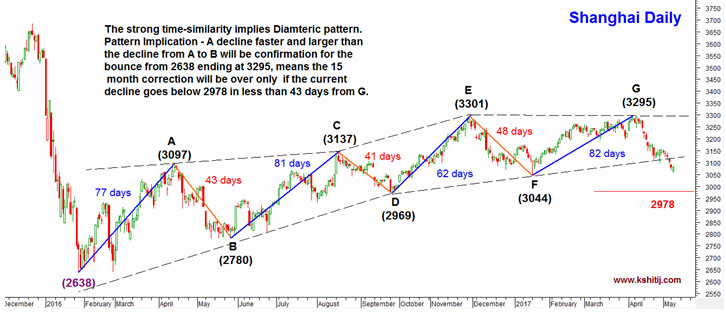
Among the global Equity Indices, the Shanghai is the most worrisome at the moment. The chart above marks the number of days taken in each major movement since the beginning of 2016. There is a strong time-similarity between the rallies and declines, pointing to 7-legged Diametric as the most probable pattern formation. This gives us a clear tool to gauge if the entire rise from the 2016 low of 2638 is over at the 2017 high of 3295 or more sideways consolidation in 3000-3300 is to be expected.
A break below 2978 in less than 43 sessions, the duration of the decline from 3097 (A) to 2780 (B), the first and largest decline inside the pattern, (i.e. by 19th May’17) will confirm the end of the rise from the 2016 low of 2638 to the 2017 high of 3295. If that happens, then the 3295 can be taken as a major top and further decline towards 2600 or even lower can be expected in the coming months.
In case, the decline remains smaller and slower, then the probability of further sideways consolidation in the range of 3000-3300 (+/- 50) will increase significantly.
We check the global markets in the next pages, particularly the US market and the Indian markets along with the World Index.
World Index
While the Shanghai Index looks potentially bearish, the World market remains indifferent to the turmoil in the Chinese markets and continues to rally. The most conservative Elliott Wave count above points towards a target of 2005 (a gain of 6.6% from the current levels) before any significant correction. However, we have to be careful about channel resistance near 1960-70 (4.5% gain).
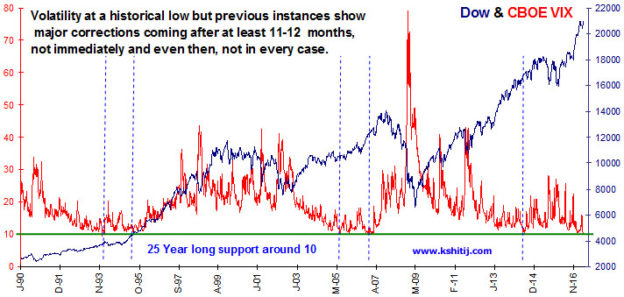
Volatility at 25-year low but not a danger signal yet
 Fear about a sudden crack in Dow has been spreading globally as the historically low levels in VIX is seen taken as a sign of complacency, which could be a precursor to a fall. But as the chart above shows, not all collapse in volatility gives birth to major corrections and if and when a major correction actually comes, it generally takes place after another 11-12 months. VIX has just hit the 25-year lows in the area of 10.00-9.00, implying more upside may be left in the coming months before any major top formation. We may look for signs of possible topping out in Dow near 21700-800 but not before that.
Sensex remains strong
 |
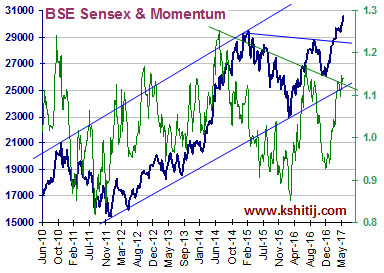 |
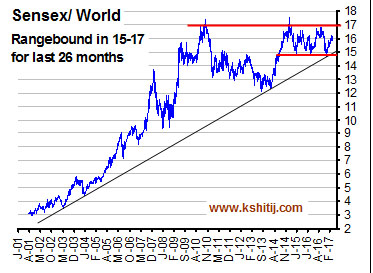
The left chart that the Sensex/World ratio is very stable in the range of 15-17 with little chance of breakout, which means no significant outperformance or underperformance is expected in the near term. On the other hand, as seen in the chart on the right hand side, both Sensex and the underlying momentum (green line) are seeing major breakouts above their earlier resistances, signaling continued rally with no visible fatigue yet. Sensex may rise to 32000-300 in the next 2 months, similar level for Nifty being 10000.
Conclusion:
We will be watching if Shanghai breaks 2978 within 19th May’17 and confirms a resumption of the major bear market but Dow can rise to 21700-800 and 22500 after the current consolidation. The comparative outperformance of the Indian markets against World may push Nifty to 10000 (Sensex 32000-300) in the next couple of months on a firm break above 9500 (Sensex 30400-500). 9500 is the make or break area for Nifty as chances of a mean reversion towards 9100 remain open till a sustained move above 9500 is seen.

Ranajay Banerjee
Leads the research team at KSHITIJ,COM. Has a deep understanding of Elliot Waves and a formidable memory of market history. Well known on Twitter as @ranajayb with a considerable fan following. Film scriptwriter by night.
Array
As expected in our last report (09-Dec-25, UST10Yr 4.16%) the US Fed indeed reduced the Fed Rate further by 25bp to 3.75%. We had also said that we expect another …. Read More
Crude prices have been steady and tilted to the downside over the last few months. Hovering near $60, can it gradually move up towards $70? Or could there be room for more fall towards $55/50? … Read More
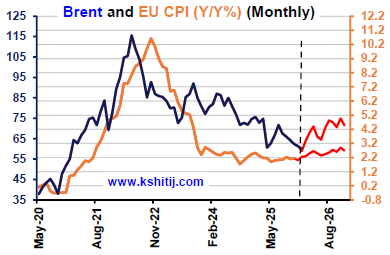
Brent and EU Inflation has been low in the last few months. If both the EU Inflation and Brent see a gradual rise in 2026, the upside could be …. Read More
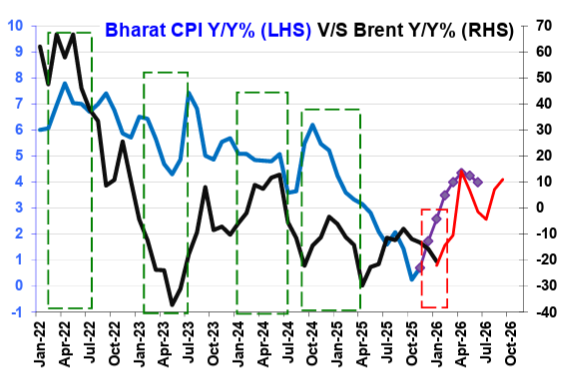
In our 04-Dec-25 report (10Yr GOI 6.54%) we conceded that RBI may cut the Repo due to the unexpectedly sharp fall in the Oct-25 CPI to 0.25%. The RBI then indeed … Read More
In our 10-Dec-25 report (USDJPY 156.70), we expected the USDJPY to trade within 154-158 region till Jan’26 before eventually rising in the long run. In line with our view, the pair limited the downside to … Read More
Our January ’26 Dollar Rupee Quarterly Forecast is now available. To order a PAID copy, please click here and take a trial of our service.
- Kshitij Consultancy Services
- Email: info@kshitij.com
- Ph: 00-91-33-24892010
- Mobile: +91 9073942877

