

Crude Oil Report - Feb'18
Feb, 22, 2018 By Saandhy Ganeriwala 0 comments

22-Feb-18: Brent 65.25; WTI 61.34
RECAP
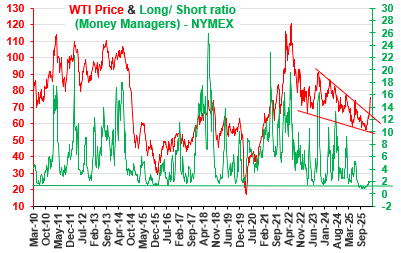
In line with the forecast in our Jan’18 report, a corrective dip in crude prices did take place (down to 61.76 in Brent and to 58.08 in WTI) after both saw highs of 71.28 and 66.65 respectively. Further, overbought conditions in WTI derivatives also receded as predicted (ratio of long to short positions by Money Managers falling from 14.58 to 13.42 currently).
EXECUTIVE SUMMARY
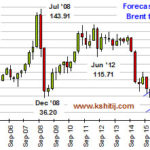
Although Brent (B) and WTI (W) have presently risen to 65.25 and 61.34 respectively after the corrective dip earlier, we see the upside in Jan-Mar restricted by 21-day moving averages for both - 66.8 (B) and 63.04 (W). A dip towards channel supports and longer term moving averages – 57-55 (B) and 53 (W) in Apr-Jun is forecasted, after which the market can rise till 77 (B) and 70.5 (W) in Oct-Dec’18, in line with our earlier forecast. An interesting pattern in US Crude inventory trends supports our above hypothesis. Further, we forecast the global Demand-Supply Balance (quarterly) for crude in 2018, which also makes us bearish on Crude in the 1st half and bullish in the 2nd half of the year.
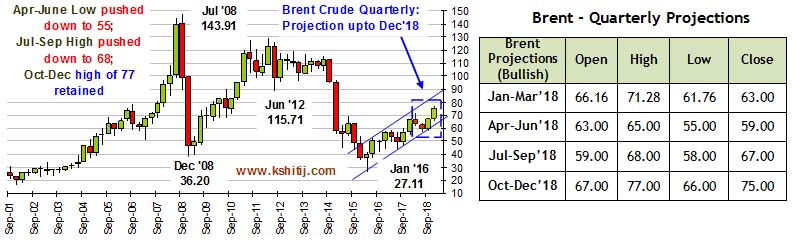
NEAR TERM DIP TO BE MORE PRONOUNCED
Our forecasts for the next four quarters is given in the above quarterly candle chart. The downside in the 2nd quarter is revised to 57 (outside chance of 55) from 62.50 earlier based on technical charts (see below) and the startling surge in US crude production (already at 10.27 million bpd – surpassing Saudi Arabia). The near term dip should be backed by a dip in refinery demand in USA and the Middle East, due to maintenance closure of refineries. At the same time, the extension of the OPEC-Russia output cuts till 2018-end can lead to higher prices by end-2018.
BRENT CAN DIP TO 57-55
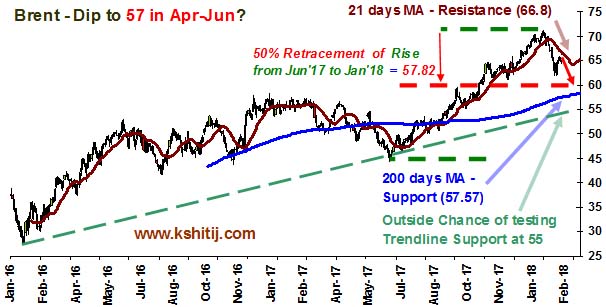
While below 66.80 (21 DMA) Brent can test strong Support at 57.57 (200 DMA) in Apr-June.
Further, 57.82 is the 50% retracement of the rise from 44.35 (Jun’17) to 71.28 (Jan’18). This coincides with 57.57 (200 DMA) mentioned above making it a strong Support.
A dip below 57.57 (less preferred) would test trendline support at 55.
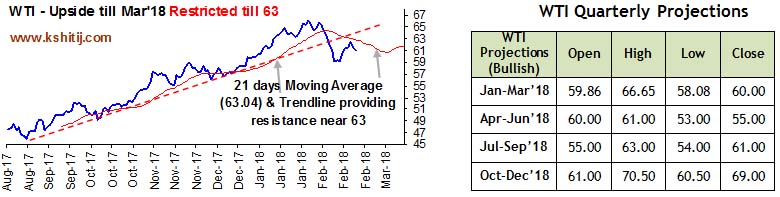
WTI: DIP TO 53, THEN UP TO 63.00-70.50
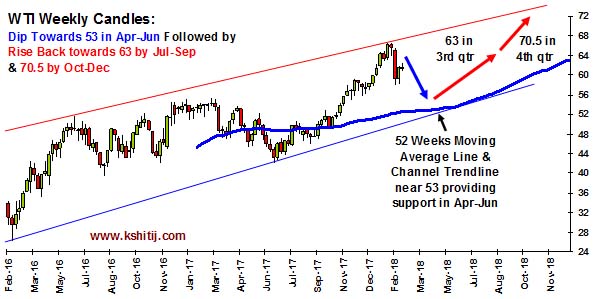
The 21 DMA on the upper left chart along with the trend line resistance should limit the current rally till 63. The adjacent chart further shows that both the 52 weeks MA and the channel trendline could provide support near 53 in Apr-Jun. That should be then followed by a bounce towards 63 in Jul-Sep and a further rise towards 70.5 in Oct-Dec. This is well in line with the outlook on Brent.
US CRUDE STOCKS & WTI PRICE
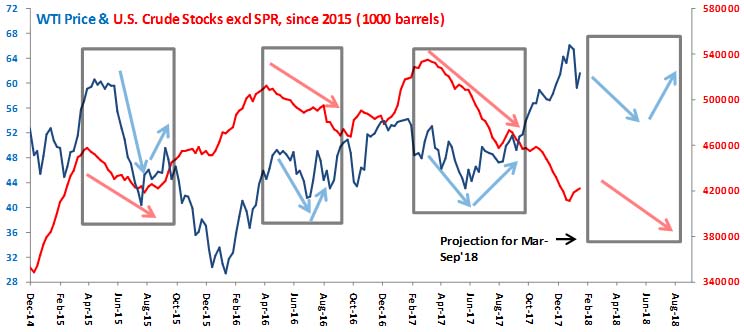
US Stocks and WTI Price fall together till June-Aug; WTI rises thereafter
We see above the repeat of an interesting phenomenon in the Mar-Sep periods of the last 3 years. Contrary to normal logic, a fall in US stocks is seen to be accompanied by a fall in WTI prices till June-Aug. Without going into why this happens, if the pattern repeats this year, a slight fall in stocks might be accompanied by a dip in WTI towards 53 by June, to be followed by a rise going in to September.
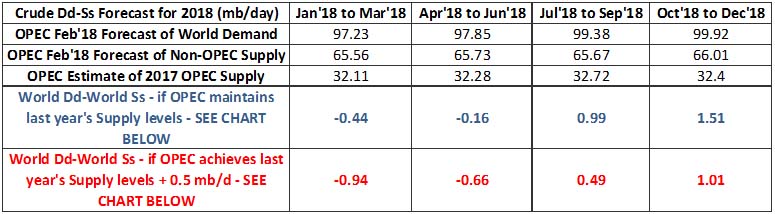
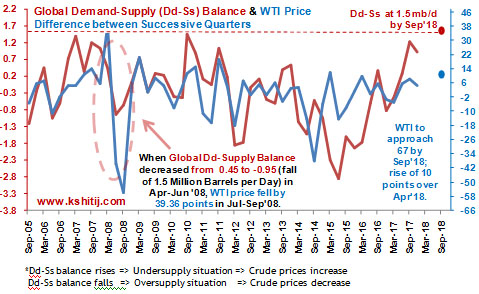
 DD-SS TO DIP AND THEN RISE
In the table above, we show the forecast for global dd-ss balance in different quarters of 2018, corresponding to 2 possibilities:
(1) OPEC production being maintained at 2017 levels (continuation of output cuts),
(2) OPEC production increasing by 0.5 mb/d in 2018 (if output cuts are not followed).
(Note that the expected rise in US crude production is already incorporated in the non-OPEC supply forecast in the 3rd row)
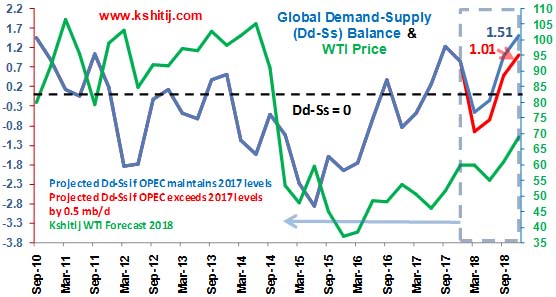
The above 2 possibilities for Demand-Supply trend are also shown in the blue dotted box in the above chart, as is the corresponding WTI forecast. We see that in both cases, the dd-ss balance is seen to be dropping below the 0 line in the next 2 quarters, followed by a rise beyond 1 mb/day. Given the correlation in WTI price and dd-ss balance, the above forecast is yet another reason for our near term bearishness and long term bullishness on crude.
THINGS TO LOOK OUT FOR:
- Closing of Refineries for Maintenance in Saudi Arabia (Yanbu Refinery), Middle East, USA etc in Mar-June leading to a fall in Crude demand
- Rise of US Crude Production beyond the current 10.27 mb per day towards EIA’s estimate of 11 mb per day by 2018-end
- Backwardation trend in Crude Futures: Spread between Price of 1 month Futures and 6 month Futures – currently at 1.86 (WTI) & 1.54 (Brent) – a dip below these levels towards 0 could imply some bearishness ahead
CONCLUSION
The upside in Jan-Mar should be restricted by 21 days moving averages - 66.8 (B) and 63.04 (W). A dip towards channel supports and longer term moving averages – 57-55 (B) and 53 (W) is forecast in Apr-Jun (also on back of forecasts indicating lower global demand-supply balance during the period). Post July, we retain our earlier forecast of a gradual rise till 77 (B) and 70.5 (W) in Oct-Dec’18.

Saandhy Ganeriwala
Saandhy is a postgraduate in Economics, but like all good market-men, he seeks confirmation from technical analysis charts for his macroeconomic ideas. His research is a good mix of charts, stats and econ. Apart from that, he calls himself a news junkie and an occasional writer.
You may also like:

In our last report (28-Jan-26, UST10Yr 4.23%) we had established the linkage between higher Crude and higher Inflation leading onto higher Yields and had said Yields were likely to move up along with …. Read More
The Net Long short position for WTI has started to move up. Currently above 2, will it rise sharply towards 4-6 and higher or fall back towards 1.5 or lower? The US-Iran conflict has lead to a sharp rally in crude prices. Will it dominate prices in the coming months? … Read More

Our view of a fall towards 1.14 seems to be playing out well so far as the tensions in the Middle East and the US-Iran conflict have triggered a rise in Dollar Index and crude oil prices, thereby weakening to Euro to 1.1507 so far in Mar-26. Will it again attempt to rise targeting 1.20? Or will it remain below 1.19/20 now and see an eventual decline to 1.10? …. Read More
The Real 10Yr Yield at 0.90% plus CPI at 6.2% implies that the nominal 10Yr GOI rate can … Read More

In our 10-Dec-25 report (USDJPY 156.70), we expected the USDJPY to trade within 154-158 region till Jan’26 before eventually rising in the long run. In line with our view, the pair limited the downside to … Read More

Our March ’26 Dollar Rupee Monthly Forecast is now available. To order a PAID copy, please click here and take a trial of our service.