
Long-Term forecast for Crude in 2008 and Dollar-Yen discussion
Jan, 16, 2008 By Vikram Murarka 0 comments

Nymex Crude, Feb Futures: $92.69
Crude Oil futures have been in a bull market for the last 9 years, rising 867% from a low of $10.35 (Dec-98) to a high of $100.09 (Jan-08). In such a situation, it is imperative that one does proper risk-reward analysis. We try to anticipate Crude's behavior in 2008, especially since USA, the world's largest consumer of Crude, stands on the cusp of a recession. Take a look at the continuous monthly chart of the near-month Nymex Crude Futures:
Trend Line Analysis
The RED trendline on the chart above, joining the highs of $39.99 (Feb-2003), $70.85 (Aug-2005) and $99.29 (Nov-2007), provides resistance near $100.00-102.00. This trendline might not break in the first few months of 2008. As such, Crude can target $85.00 in the next 6-months and $75.00 further out, as shown by the BLUE arrow above. The target of $75 falls on the GREEN trendline, drawn from the low of $26.65 in Sep-2003.
Elliot Wave Analysis
The chart above shows a remarkable 5-wave pattern over the last 9 years. Wave-1 is traced from a low of $10.35 (Dec-98) to a high of $37.79 (Sep-00), a rise of 270% in just 21 months. The corrective Wave-2 extended from the high of $37.79 (Sep-00) to a low of $17.12 (Nov-01). This was a 54% decline, in a period of 14 months. Importantly, this decline occurred after the "dot-com" bubble burst in early 2000 and the US went into a recession in 2001, emphasising the importance of US demand for Crude prices.
Wave-3 lived up to its reputation of being the biggest friend of bulls. Prices rose from the low of $17.12 in Nov-01 (post 11-Sep-01) to $77.95 by Jul-06, a whopping 355% rally in 57 months. This bull run even overcame the massive hurricanes, Katrina and Rita, of 2005.
The 4th Wave was the shortest in terms of time, but the most brutal in terms of price. From a high of $77.95 in Jul-06, Crude fell sharply to a low of $49.90 in Jan-06, a decline of 36% in just 6 months. From there, the final Wave-5 has extended to a high of $100.09, see on 03-Jan-08.
However, Wave-5 has run into the RED trendline shown above. As such, we may now see an ABC correction, targeting $75, as depicted by the BLUE arrow above. The chances of a US recession could work to further support the Bear case.
We now magnify the period from May-05, by looking at the Weekly chart.
The RED trendline on the chart above, joining the highs at $75.35 (Apr-06), $77.45 (June-06) and $99.29 (Dec-07) , provides resistance in the $100-$102 region. Note, however, the GREEN trendline on the downside. This has been coming up since Aug-2007, and now provides support near $92.00. Thus, while $92.00 holds on the downside, there could be a final dash in Crude towards $100.00-102.00 in the next 4-5 weeks, where the trendlines are converging (circled area above) in the chart above. Alternatively, should $92.00 break immediately, Crude may trade within $96.00 - $86.00 for the next several weeks.
DOLLAR-YEN @ 106.00... A small bounce to 110?
 Dollar-Yen is trading at its lowest level since 2004, threatening to test the 2004 Low near 101.68. What are Interest rates saying about the currency rates?
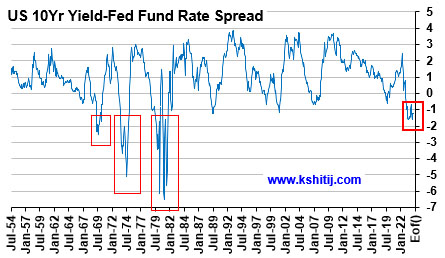
The chart alongside shows the USDJPY exchange rate (RHS) juxtaposed on the 10-Yr Bond-JGB yield differential (LHS).
The differential (currently 2.31%) is close to the lowest level it has seen several times since 1995. This suggests that the differential could increase (bounce back) in the weeks/ months ahead. But, is this possible in the current environment where the US is facing recesssion and the market is factoring in a 75bp cut in January and possibly more in the months ahead?
 |
 |
| Note that the US-10 Yr Bond Yield is near 3.75%. It could dip by maybe 20bp in the foreseeable future, even if the Fed rate falls by 75 bps. This is consistent with the overall curve steepening that we are seeing in the USA right now. | The "curve steepening" can be seen in the chart above. The 10-5 Yr Bond Differential has chances of rising further towards 0.85% as against the current differential of 0.70%. |
 Now let us take a look at the JGB Yields. The 10-Yr JGB Yield, currently near 1.43%, can dip to 1.25-1.20%, to touch the RED trendline in the chart alongside.
Thus, even if the US 10-Yr dips to 3.55% and the JGB 10Yr dips to 1.25%, the Bond-JGB Differential will remain steady around the current 2.30. Please refer again to the chart of the US Bond-JGB Yield Differential versus the USD-JPY rate, shown on the top. It may be noticed that the USDJPY rate has recovered/ bounced whenever the Yield Differential has come down to the 2.37-35% region, as depicted by the Red Trendline in that chart.
 Little reason, therefore, to sell the USDJPY aggressively near current levels. Admittedly, the long-term trendline joining the lows of June 1995, Jan 2005 and Nov 2007, as seen in the chart alongside, has been broken today. However, we need to wait through this week, possibly the next also, to assess whether or not it is a false break. History and evidence suggests that there could be a small bounce in Dollar-Yen to about 110 over the next 1-6 months. However, a subsequent fall, even past 106 cannot be ruled out.

Array
You may also like:

In our last report (23-Feb-24, US10Yr @ 4.25%), we had laid out our near term view (that the ongoing rise in the US10Yr may/ may not extend up to 4.5%), our medium term view (that the US10Yr can still fall to 3.5%) and our long term view of a rise towards 5.0% and higher going into 2025. …. Read More
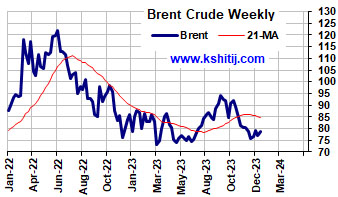
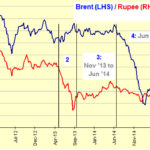
After breaking above the earlier range of $70-85, Brent has moved up higher. Will it sustain and break above $90? Or will it fall back to $80/70? … Read More
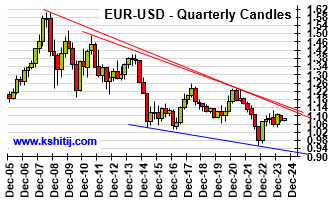
Euro could not move above 1.0981 in March and has been trading well below 1.10 post the surprise rate cut by SNB last month. Will Euro continue to trade below 1.10? Or can it remain stable for a while and show a sharp breakout above 1.10? ……. Read More

Our April ’24 Quarterly Dollar-Rupee Forecast is now available. To order a PAID copy, please click here and take a trial of our service.
Our March ’24 Monthly Dollar-Rupee Forecast is now available. To order a PAID copy, please click here and take a trial of our service.