

Bund-Bond Yield Differentials suggest strength in EUR-USD going forward
May, 08, 2009 By Vikram Murarka 0 comments


- Yield Differentials suggests strength in EUR-USD going forward
- Corrigendum – The Sensex has strength of its own also
Yield Differentials suggest strength in EUR-USD going forward
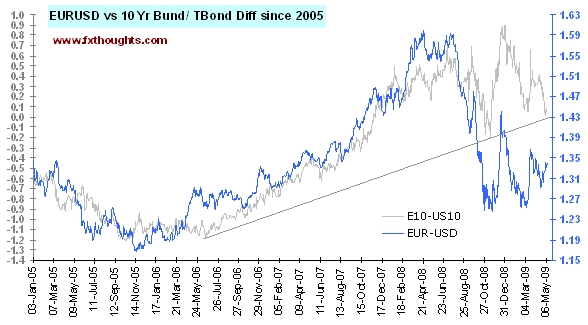
Take a look at the Bund-Bond Yield Differential v/s EUR-USD chart below. The blue line on the graph represents the EUR-USD rates (tracked on the right hand scale) while the grey line charts the differential between 10-yr yields on EUR Bunds and US T-Bonds, on the left hand axis. There is a positive correlation between the Yield Differential and the EUR-USD exchange rate. Simply put, the Euro rises against the Dollar if the Bund yields rise in comparison to the Bond yields. Emerging trends in the yield differential can, therefore, provide a good idea on where the EUR-USD could be headed.
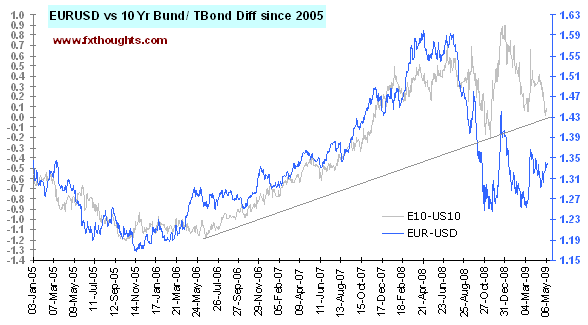
There is a trendline coming up from the Jun-06 low of –1.18% on the Yield Differential chart, joining the Nov-08 low of –0.2%, which now provides support just below the current differential level of 0.06%. Should this Support remain intact, the differential may increase going forward. That would be a positive for the Euro vis-à-vis the Dollar.
 To determine the chances of the differential increasing going forward we first look at the US Yield chart alongside which shows yields on 10 and 30 yr T-Bonds. The 30-Yr Long Bond yield (4.29%) has reached a Resistance level (see the Red trendline). The 10-Yr yield (3.32%) has the potential to rise some more before it meets Resistance at 3.5%. If the Resistances on the 30-Yr and 10-Yr hold going forward, the yields could fall, sending the Bund-Bond differential up.
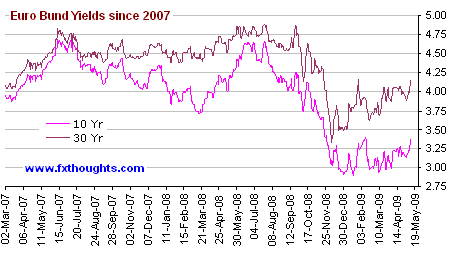 Further, Euro Yield chart alongside shows that the yields have been rising since the beginning of March ‘09 and have at least a 50% chance of rising further. If so, this too could boost the Bund-Bond yield differential.
All of this, put together, would be bullish for the Euro. However, in case the Bund-Bund Yield Differential (currently +6 bp) goes into negative territory going forward, the Euro could take a big beating against the Dollar.
 The make-or-break situation on the Bund-Bond Yield Differential chart is reflected in the Euro chart as well.
As can be seen on the 3-day Candlestick chart alongside, there is a trendline coming down from the Jul-08 high of 1.6038 that provides Resistance near 1.3550.
If and while this holds, there may be a chance of the Euro falling back towards 1.25 in the weeks/ months ahead. However, should this Resistance at 1.3550 break, the Euro could skyrocket to 1.40-42.
The Sensex vis-à-vis the World – A Corrigendum
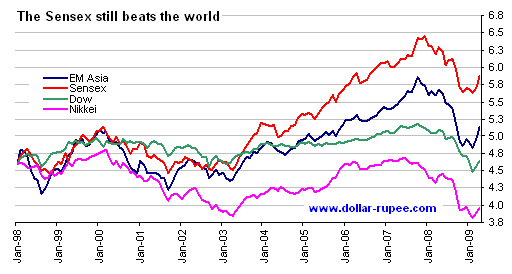 The chart alongside plots the Log of the percentage move in Sensex, Dow Jones Industrial Average, Nikkei and MSCI's Emerging Market Asia indices since Jan-98. The Sensex is seen to have outperformed all the other indices, compared to the Jan-98 levels. The Sensex outperformed the others in the bull run of 2003-08. Even during the fall of 2008-09, it was beaten only by the Dow. It beat both the EM index and the Nikkei during the fall.
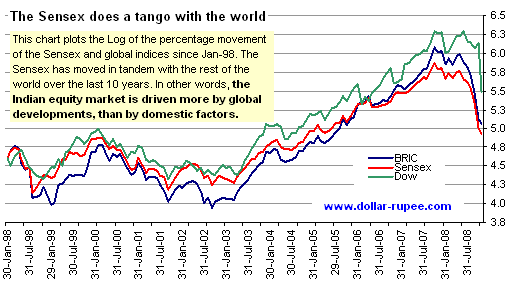 This fresh finding contradicts and corrects our earlier assertion that the Sensex moves in tandem with the world, implying there is no diversification benefit in the Sensex (and by extension, India) vis-à-vis the rest of the world. The incorrect chart, which was published in our annual print Calendar, is given alongside for reference. The error occurred due to reference to an incorrect data series, and somehow escaped internal quality checks.
We tender sincerest apologies to all concerned for the error.

You may also like:

In our 10-Dec-25 report (USDJPY 156.70), we expected the USDJPY to trade within 154-158 region till Jan’26 before eventually rising in the long run. In line with our view, the pair limited the downside to … Read More
In our last report (04-Sep-26, UST10Y 4.77%) we had noted chances of a slowdown ahead but since Crude could spike up, we retained our view of the US10Yr rising to 5.10% by Nov-26 and 5.40% by Mar-27. As it turns out, Brent did indeed rise to …. Read More
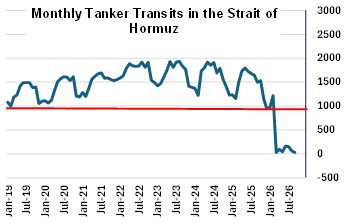
In our September 2026 report (11-Sep-26, Brent @ $103.84), we had expected Brent to range within $90-115 for the next 1year. Prices were expected to remain elevated, primarily driven by the low volume of vessel transit in the Strait of Hormuz. Brent indeed traded within $109.97 and $90.70 in Sep-26, within our expected range. … Read More
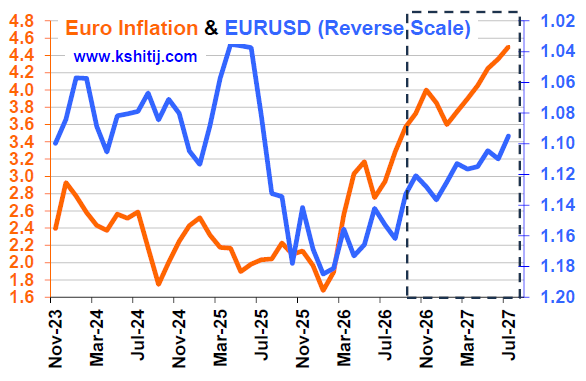
In our September 2026 report (4-Sep-26, EURUSD 1.1620), we revised our Euro forecast upwards due to lack of followthrough selling below 1.14. We expected the Euro to range between 1.1980-1.13 for the next 1yr. However, in line with our earlier bearish outlook, the Euro fell sharply to …. Read More
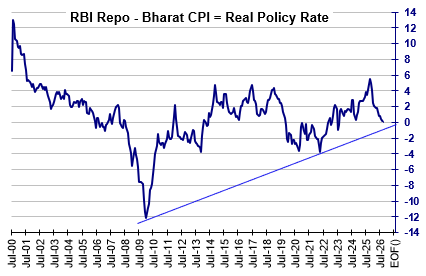
In our 10-Sep-26 report (10Yr GOI 6.98%), we had noted that the Long end of the Curve, viz. the 10Yr GOI was rising due to a number of factors. We said, “Whether the RBI will raise rates on 07-Oct will depend on whether Crude happens to be breaking higher or would have cooled off from $105 to $95” … Read More

Our October ’26 Dollar Rupee Quarterly Forecast is now available. To order a PAID copy, please click here and take a trial of our service.