

An Inverted Yield Curve does not necessarily imply recession
Dec, 22, 2006 By Vikram Murarka 0 comments


Conventional market wisdom tells us that Yield Inversion usually leads to a recession. Yield inversion happens when long-term yields trade below short term yields. Most of the time, the focus of the inference is usually on the US economy. There has been a lot of debate on the subject. We did not know about the existence of a debate till now, when we did a quick internet search on the subject. Some experts, notably the Fed, say that an inverted yield curve does not imply recession. Some others aver that it does.
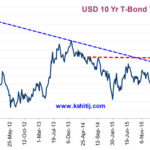
Our own independent study was born of the observation that the Dow Jones Industrial Average (DJIA) has been going up through 2006 even though the Yield Curve has been inverted. We wondered how this was so, when common wisdom suggested otherwise. We took data from the Fed websites and looked at the performance of the DJIA during periods of yield inversion, to see if the Dow fell during such periods. We have used the difference between the US 10-Year T-Bond yield and the Fed Funds rate to measure the Yield Inversion. A negative (when the 10-Yr yield is less than the Fed Rate) value means the Yield Curve is negatively sloped, or inverted. The results can be seen below.
The periods of yield inversion are circled in red. There have been six major instances of yield inversion since 1972. The DJIA has fallen during three of these and gone up during the other three. Notice that the period from 1962 to 1981 saw a secular rise in interest rates. Since then, however, interest rates have been in a secular decline. The first two periods of yield inversion occurred between 1972-81, when interest rates were on the rise. They were both relatively prolonged and both were accompanied by a fall in the Dow. In fact the Dow fell some 34% in the very first instance. It fell around 6% in the second episode of yield inversion.
Thereafter, since interest rates started falling from 1981, the Dow has fallen in only 1 out of four periods of yield inversion, and that too only 9%. Further, note that the periods of yield inversion have been relatively short, never more than a year in duration.
Based on the above empirical evidence, it cannot be inferred that yield inversion leads to recession. If anything, we may venture to say that recessions are more likely during periods of prolonged rate increases and less likely during periods of prolonged rate decreases. Or in other words, it is interest rate increases/ decreases that matter more than the shape of the yield curve.
Risk/ Reward - Enhanced!
Of TPs and SLs
Most Traders will agree that 60% of the times they miss their Take Profit (Limit) orders by 2-5 pips, or miss a dream Entry Order by 2-5 pips. And frustratingly, 60% of the times their Stop Loss Order gets triggered just 2-5 pips inside the top/ bottom of the market. Is this not true?
Why should this be so? Is a strange diabolical phenomenon perpetually working against the Tribe of Traders? No. Looking at things dispassionately, it is clear that we tend to place our TP (Limit) at levels that are 60% more difficult to reach, while our SLs are 60% easier to reach.
The phenomenon that is working against us is our own Greed (which makes us place the TP that extra 5 pips wider, to earn more) and our Fear (which makes us place the SL that extra 5 pips narrower, in order to keep losses at a minimum). The old adage of "Cut your losses short and let your profits run" also has a hand in most Traders wanting to keep relatively wider TPs and relatively narrower SLs. But unfortunately, we find the SLs getting triggered while the TPs are missed. All that might be needed, therefore, might be to make the TP narrower by 10 pips and the SL wider by 10 pips.
Risk/ Reward Ratio
But wouldn't keeping a narrower TP and a wider SL make the Risk/ Reward Ratio go out of whack?
For the uninitiated, the Risk/ Reward Ratio is one of the oldest tools of Risk Management and Loss Containment. It says that, as a rule, for any given trade, the ratio of Risk (Loss) to Reward (Profit) should be less than 1, or in other words, the Risk should be less than the Reward. Obviously. Otherwise why would one trade? Or, at the least, the Ratio should be 1 (Risk = Reward). It should never be greater than 1.
How does one get an RR less than or equal to 1? Simply by choosing Profit and Loss targets appropriately. For instance, a Trader may keep her Profit target at 50 pips and the Loss target also at 50 pips, to arrive at an RR of 1. Another, more conservative Trader may place a TP 75 pips away from Entry and keep the SL 50 pips away, thereby ensuring that the RR is less than 1 (50/75).
In this way, both of them reassure themselves that they are responsible and disciplined Traders. The RR Ratio is, in fact, a good tool and does prevent a lot of loss. But, as we've seen before, our greed/ fear ratio (another word for conservatism) makes us lose money 60% of the times, because simply placing the SL/ TP at favourable levels for a good RR Ratio does not ensure that the SL will not be triggered and the TP will be triggered. Thus, the need for narrower TPs and wider SLs.
But, coming back to the question, wouldn't keeping a narrower TP and a wider SL make the Risk/ Reward Ratio go out of whack? Suppose a Trader who usually works for a 50 pip profit and a 50 pip loss (RR = 1), now works for a 40 pip profit and a 60 pip loss, her new RR would be 60/40, greater than 1. How can that be acceptable?
Risk/ Reward Ratio Redux
All the RR calculations/ scenarios above are sans any Probability consideration. Or, at best, the implicit assumption is that the chances of both Profit and Loss are equal.
But, suppose placing the TP 10 pips narrower increases the chances of it getting executed, and a 10 pip wider SL reduces the chances of it getting triggered. Would that not be more desirable than equidistant TP/SL combinations or wide TP/ narrow SL combinations? Thus, we now take a fresh look at the Risk Reward Ratio. Welcome the RR with Probability.
Consider the following table:
| Base Case | Fresh Case # 1 | Fresh Case # 2 | |
| SL (pips) | 50 | 60 | 65 |
| TP (pips) | 50 | 40 | 35 |
| Probability of Loss or P(SL) | 50% or 0.5 | 40% or 0.4 | 30% or 0.3 |
| Probability of Profit or P(TP) | 50% or 0.5 | 60% or 0.6 | 70% or 0.7 |
| Risk/ Reward Ratio calculation | SL/ TP | SL x P(SL) / TP x P(TP) | SL x P(SL) / TP x P(TP) |
| Risk/ Reward Ratio Result | 50/ 50 = 1.0 | 60 x 0.4/ 40 x 0.6 = 24/24 = 1.0 | 65 x 0.3/ 35 x 0.7 = 19.5/25.5 < 1.0 |
In the Base Case, where the chances of profit and loss are assumed to be equal, the only way to achieve an RR of 1 is to keep the SL and TP equal distances. But, in the Fresh Case #1, the chances of Loss are seen to be lower than the chances of a Profit, precisely because the SL is wider than the TP. This suggests that a narrower TP and wider SL can also be acceptable if the probabilities are favourable.
You could stretch this a bit more (provided the probabilities continue to be favourable) to achieve an RR < 1, as seen in the Fresh Case #2. This is certainly more favourable than the earlier case.
But, can we keep stretching this by bits? A bit more, and then a bit more and so on? NO. It would not be possible, beyond a certain tipping point to keep narrowing the TP and widening the SL. Also, say you were working with a 1 pip TP having 90% chance of success and a 90 Pip SL having 10% chances, you would still get an RR of 1. BUT, the trade would NOT be advisable because even 1 such loss making trade would wipe you out.
Remember however, that this tool is to be used by Advanced Traders, who should be able to make reasonably accurate assessments of the Probability of the Risk and the Reward, apart from the usual considerations of trend determination etc.
Interesting? Roll the new RR around your tongue a few times to get the taste of it. Try it, use it. But do not overdose on it and try to work with a 1 pip profit and a 90 pip loss.

You may also like:


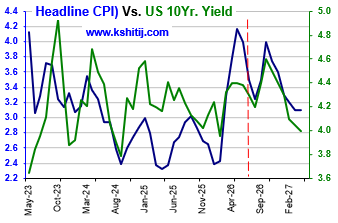
For the last few months we have been looking for Crude to rise towards $130-190 and pull up the US CPI towards 4.6% and the US10Yr Yield to 5.4% by Jan-27. This view has clearly gone wrong with Brent falling sharply below $90 as a result of the US-Iran peace deal, which is the …. Read More
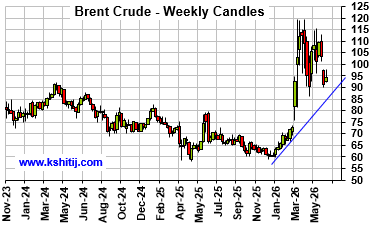
In our May 2026 report (4-May-26, Brent @ $110.75), we expected Brent to test $90.50 by Jul-26, followed by a rise to $145.13 by Sep-26 and $161.93 by Dec-26. Sustained trade below $100 was expected to be seen only on a credible resolution of the US-Iran war, which looked unlikely … Read More
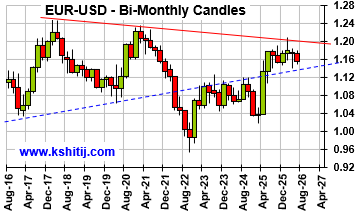
In our May 2026 report (11-May-26, EURUSD 1.1762), we expected the Euro to rise to 1.1950 by May-26 before falling towards 1.16-1.14 in the coming months. We delayed the fall to 1.10 from the earlier expected Aug-26 to Mar-27 as the Dollar Index remained within a broad range for more than expected …. Read More

In our 11-Apr-26 report (10Yr GOI 7.03%) we had retained our bullish view on Brent towards $134 by Sep-26, while allowing for a near term dip to $95 on hopes of a US-Iran resolution. Brent fell to $89.93, lower than … Read More

In our 10-Dec-25 report (USDJPY 156.70), we expected the USDJPY to trade within 154-158 region till Jan’26 before eventually rising in the long run. In line with our view, the pair limited the downside to … Read More
Our June ’26 Dollar Rupee Monthly Forecast is now available. To order a PAID copy, please click here and take a trial of our service.